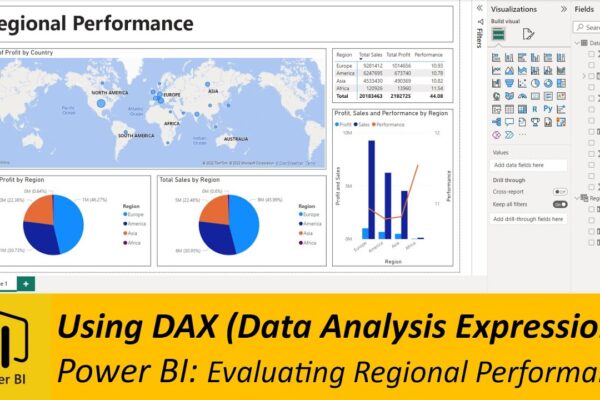
Using DAX (Data Analysis Expressions) to Evaluate Performance

Today we will use Data Analysis Expressions (DAX) to create columns and tables in the Power BI and use those tables to display visualizations. Excel file: https://docs.google.com/spreadsheets/d/1cSmnIs9vW6cyJ5Z-vf1IjV-Gb7vk7feD/edit?usp=share_link&ouid=111966831820301688680&rtpof=true&sd=true Power BI File: https://drive.google.com/file/d/1FH8r45s8sO672lBCE0VVMwYw_PQyUD6J/view?usp=share_link #powerbi #dax

Read More

Dashboards with Tooltip Pages

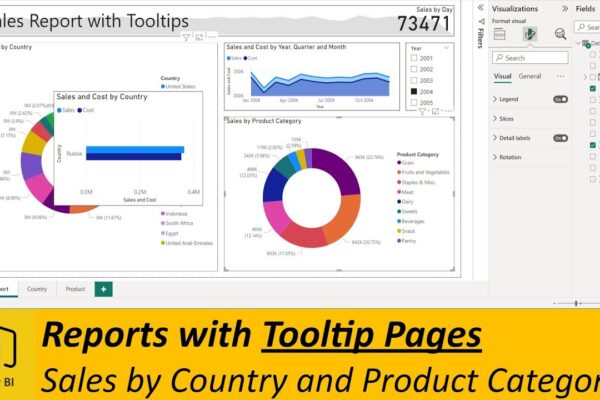
Today we will show you how to create reports with tool tip pages. We will create a sales report by country and products where products and countries will have tooltip pages which will appear when you will hover over their relevant fields. Link to the xlsx file used: https://docs.google.com/spreadsheets/d/1cSmnIs9vW6cyJ5Z-vf1IjV-Gb7vk7feD/edit?usp=share_link&ouid=111966831820301688680&rtpof=true&sd=true #powerbi #tooltip #tooltips #powerbitooltips

Read More

Team and Product Performance Analysis using Power BI

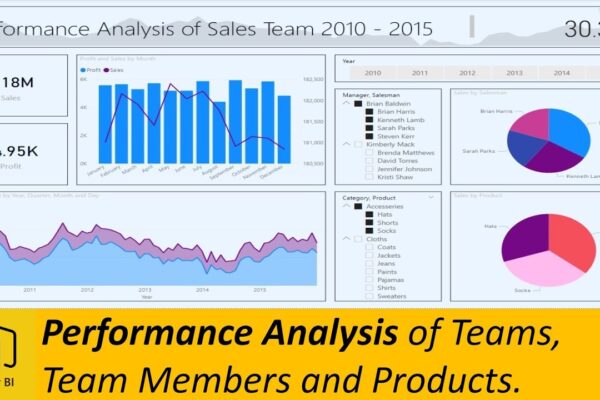
In this video, we will show you how to analyze the performance of teams, their members, product categories and products through Power BI dashboard. We will create monthly sales and profit charts and use slicers to filter the data by teams/members and products/categories. The excel file used for the data can be accessed at: https://docs.google.com/spreadsheets/d/1105HJYAt6hzP4tfY-t6W3Sf3ZDw6HRQ8/edit?usp=share_link&ouid=111966831820301688680&rtpof=true&sd=true…

Read More