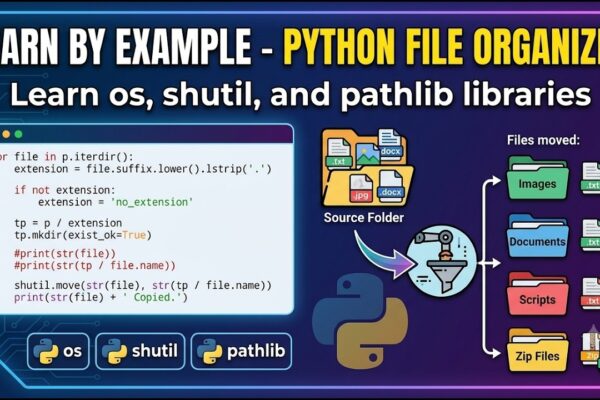
Learn By Example: Python File Organizer – Learn Windows Automation using os, shutil, and pathlib

Welcome back to another Python tutorial, where we dive into Windows automation to streamline your digital workflow. Today, we’re building a script to automatically organize cluttered folders by grouping files into subdirectories based on their specific extensions. We start by leveraging the os library for low-level system communication and the shutil (shell utilities) library, which…

Read More

Python: What is range() function in Python and how to use it? A Guide for Beginners

Welcome back to our channel! In this tutorial, we are exploring the highly efficient and flexible range() function in Python using the portable WinPython environment and the Spyder interface. The range() function is the primary tool for handling iterations, allowing you to generate sequences of numbers using one, two, or three arguments. It is important…

Read More

The Foundation of Data: Sourcing, Structuring, and Importing with Python for Beginners

Data is fundamentally a collection of random events and observations from the world around us that, while unpredictable individually, can be analyzed for deeper patterns. To make sense of this chaos, we organize these events into a structured “grid” known in Python as a DataFrame. In this architecture, rows represent individual participants or events, while…

Read More

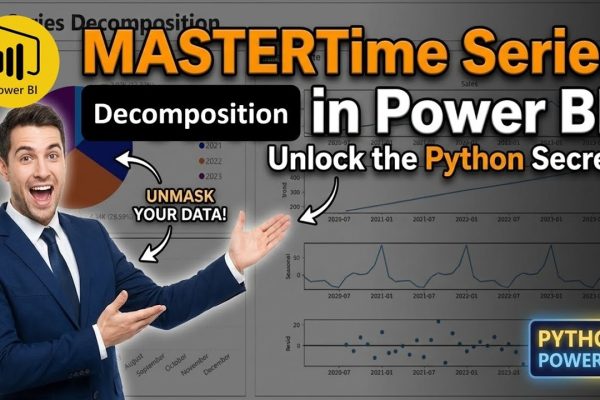
Power BI: How to Isolate Trend & Seasonality Using Python Time Series Decomposition Technique

Unlock the full potential of your data by mastering Time-Series Decomposition directly within Power BI. While standard line charts often conflate different signals, this tutorial shows you how to use the statsmodels library to “unmask” your metrics. You will learn to isolate the Trend, identify recurring Seasonality, and quantify the Residual noise that native visuals…

Read More

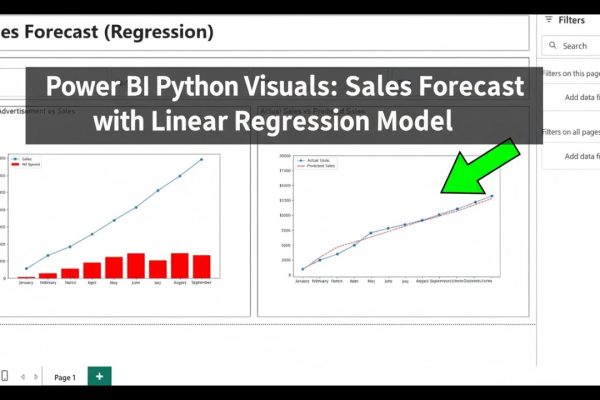
Power BI Python Visuals: Sales Forecast with Linear Regression Model

This tutorial guides you through harnessing the power of Python visuals in Power BI to perform data analysis and predictive modeling. The initial steps involve loading actual sales and advertisement data, which runs from the start of the year through September, while also including targeted ad spending for the final quarter (October, November, and December)….

Read More