Conditional Formatting Explained

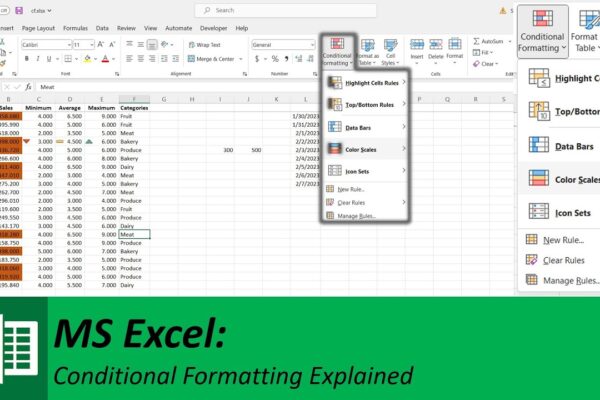
Conditional formatting in Microsoft Excel is a useful tool for highlighting and visualizing data based on specified conditions. There are several predefined rules, such as “Greater Than”, “Less Than”, “Between”, “Equal To”, “Text That Contains”, “A Date Occurring”, “Duplicate Values”, “Top 10 Items”, “Bottom 10 Items”, “Above Average”, “Below Average”, “Data Bars”, “Color Scales”, and…

Read More

Unleashing the Power of Statistics in Python: A Hands-On Guide

The video explains how to calculate basic statistics in Python. It covers the steps involved in importing libraries for statistical calculations, generating a list of random numbers, plotting the data on charts, calculating mean, median, mode, standard deviation, variance, covariance, correlation and linear regression. The results are displayed on the console window and bar chart….

Read More