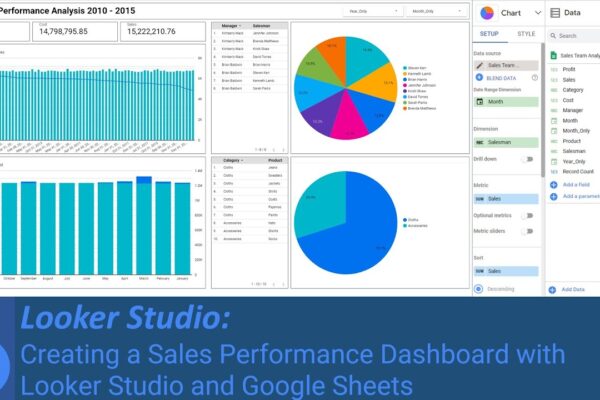
Creating a Sales Performance Dashboard with Looker Studio and Google Sheets
This video demonstrates how to use Looker Studio to analyze the performance of a sales team. It starts by connecting a Google Sheet as a source data for the Looker Studio dashboard. Then, the presenter creates a blank report and inserts a title, a date control, scorecards, a combo chart, a column chart, and pie…