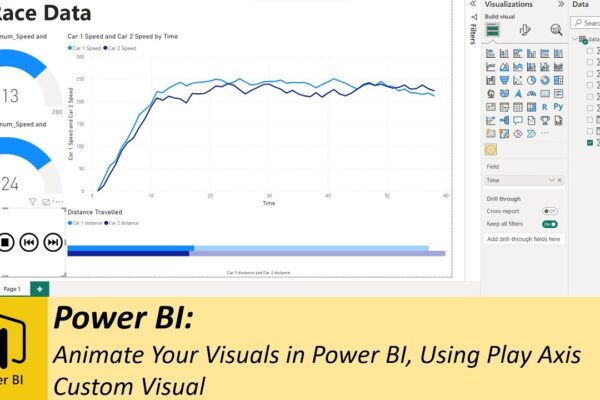
Animate Your Visuals in Power BI, Using Play Axis Custom Visual

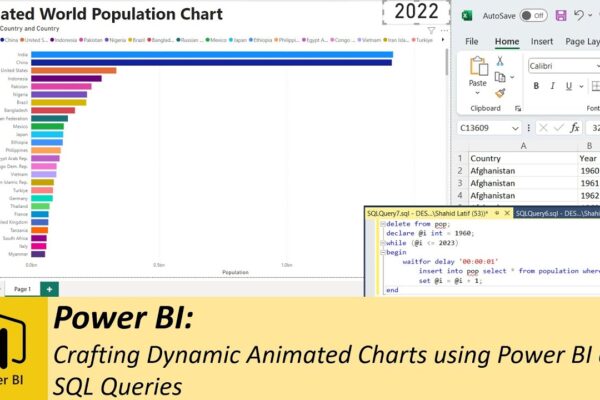
Previously, we explored various methods for animating your dashboards using SQL. Whether you want to display real-time data or historical data animations, SQL method works great. However you’ll discover that SQL isn’t always necessary, especially when dealing with historical data. Instead, we introduce you to a handy custom visual known as “play axis,” available for…
Read More

Exploratory Data Analysis (EDA) on Netflix Userbase Dataset using Power BI and DAX

In this tutorial, we will perform Exploratory Data Analysis (EDA) on the Netflix userbase dataset. EDA is a technique used to summarize and analyze data sets using visualizations. The dataset contains various fields, including user ID, subscription type, monthly revenue, joining date, last payment date, country, age, gender, device, and plan duration. To get started,…

Read More

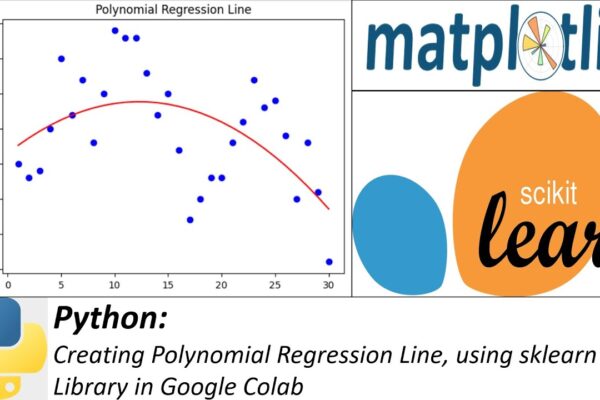
Creating Polynomial Regression Line, using sklearn Library in Google Colab

Welcome to another Python tutorial where we will learn how to create a polynomial regression line using the scikit-learn library. Polynomial regression is a type of linear regression that enables us to model non-linear relationships between variables. In this tutorial, we will cover the following steps: Colab Notebook: https://colab.research.google.com/drive/178bLanYnwxGRqCwLf0YHONBiGtGBJ1Vr?usp=sharing #PythonTutorial #PolynomialRegression #scikitLearn #DataScience #MachineLearning #PythonProgramming…

Read More