win gagasol casinosweetyspin casinobaxterbet italiasweety spinluckystar aviatorneed for slots casinoslot exo casinospinaura casinomr pachowildrobinnine casino loginchickensubway gamebaxterbet casino login

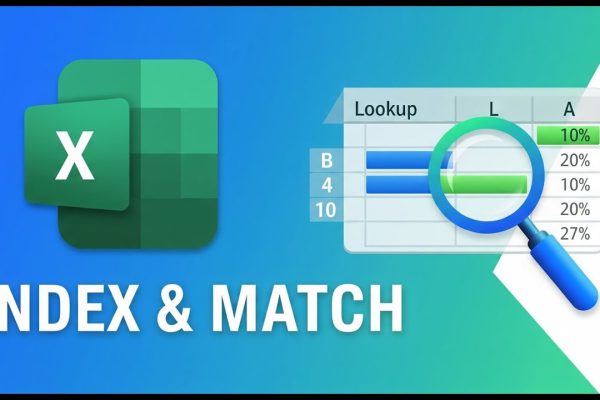
Why INDEX & MATCH Beat VLOOKUP in Excel

This MS Excel tutorial introduces the INDEX and MATCH functions, demonstrating their use with employee data including names, age, gender, employee number, and salary. The INDEX function retrieves a value from a cell based on provided row and column numbers. The tutorial explains how to determine these numbers, including using the COLUMN and ROW functions…

Read More

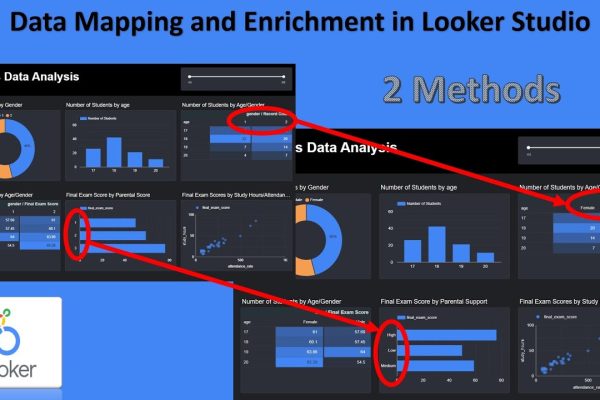
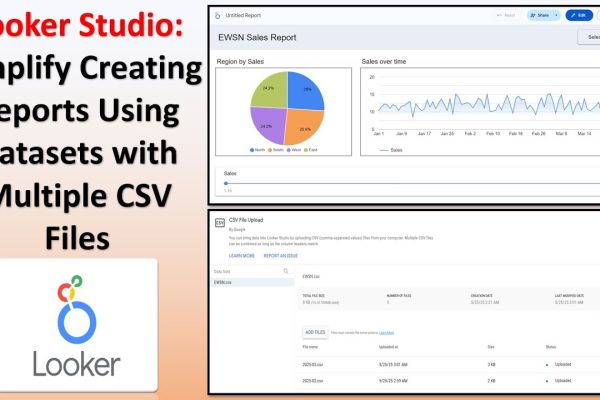
Data Mapping and Enrichment in Looker Studio using Blend or Calculated Fields

This tutorial focuses on data mapping and enrichment in Looker Studio, building upon a previous tutorial that created a student data analysis dashboard. The previous dashboard displayed gender as numerical values (1 and 2) instead of descriptive terms (male and female), and parental support as numbers (1, 2, and 3) instead of “low,” “medium,” and…

Read More

Looker Studio: Creating Responsive Reports in Looker Studio using Responsive Layout

This tutorial introduces how to create a responsive dashboard in Google Looker Studio, a feature that allows dashboards to automatically adjust to various screen sizes like mobiles, tablets, and computers. This eliminates the need to design separate reports for different devices. The process begins by creating a new Looker Report, connecting a CSV file as…

Read More

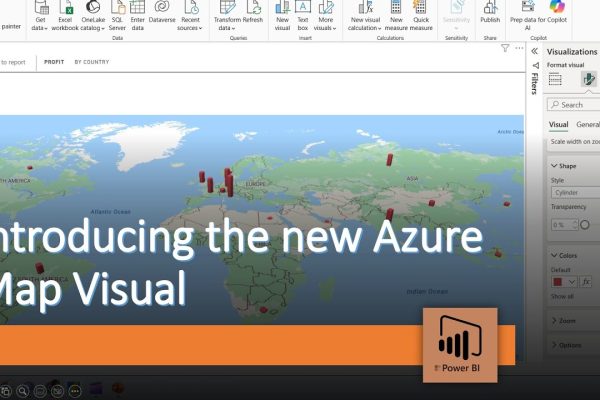
Introducing the all new Azue Map Visual

Welcome to our channel! Today’s update focuses on a significant change within Power BI dashboards. Upon attempting to access the dashboard, a prompt appeared announcing the introduction of the Azure Maps visual. This new visual is set to replace the existing traditional map functionalities that users have been accustomed to. Consequently, users are presented with…

Read More