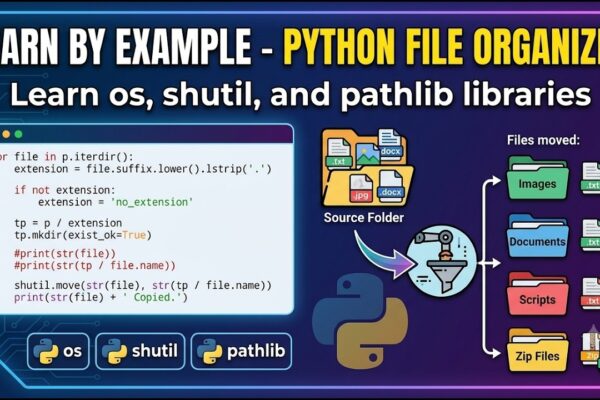
Learn By Example: Python File Organizer – Learn Windows Automation using os, shutil, and pathlib

Welcome back to another Python tutorial, where we dive into Windows automation to streamline your digital workflow. Today, we’re building a script to automatically organize cluttered folders by grouping files into subdirectories based on their specific extensions. We start by leveraging the os library for low-level system communication and the shutil (shell utilities) library, which…

Read More

The Foundation of Data: Sourcing, Structuring, and Importing with Python for Beginners

Data is fundamentally a collection of random events and observations from the world around us that, while unpredictable individually, can be analyzed for deeper patterns. To make sense of this chaos, we organize these events into a structured “grid” known in Python as a DataFrame. In this architecture, rows represent individual participants or events, while…

Read More

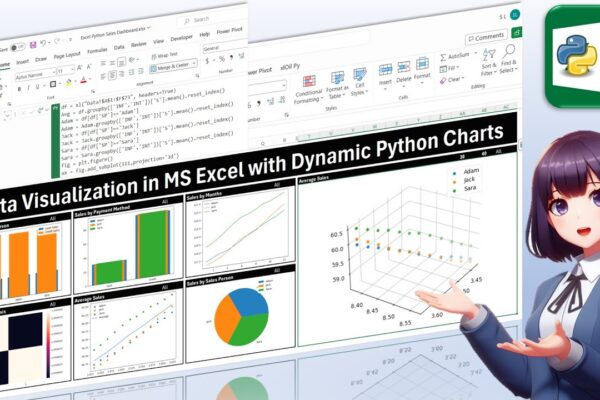
Data Visualization in MS Excel with Dynamic Python Charts

Welcome back, everyone! In this unique tutorial, we’ll guide you through creating a dynamic dashboard in Microsoft Excel using Python. Specifically tailored for those keen on mastering Python visualizations, we’ll delve into the world of Excel charts powered by Python’s Matplotlib library. Notably, unlike Excel’s native charts, Python charts seamlessly integrate within cells, providing a…

Read More

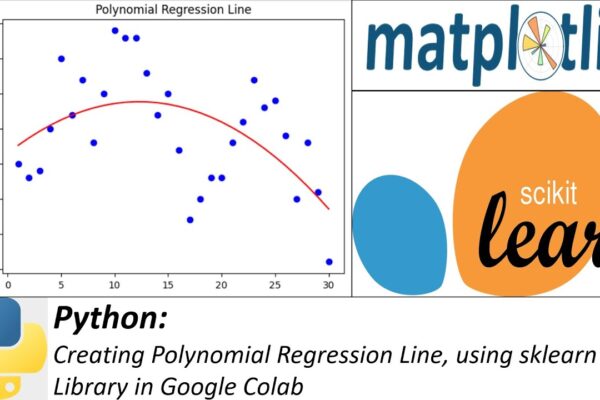
Creating Polynomial Regression Line, using sklearn Library in Google Colab

Welcome to another Python tutorial where we will learn how to create a polynomial regression line using the scikit-learn library. Polynomial regression is a type of linear regression that enables us to model non-linear relationships between variables. In this tutorial, we will cover the following steps: Colab Notebook: https://colab.research.google.com/drive/178bLanYnwxGRqCwLf0YHONBiGtGBJ1Vr?usp=sharing #PythonTutorial #PolynomialRegression #scikitLearn #DataScience #MachineLearning #PythonProgramming…

Read More