Using Unicode Symbols in Excel and Power BI and Converting Symbols to Code and Back in Excel

Unicode characters are a special coding system that allows computers to display a vast variety of text and symbols from different languages. These characters are not images, but they can be used to represent images and even create fancy lists and other visual elements within your spreadsheets or dashboards. There are different Unicode codes for…
Read More

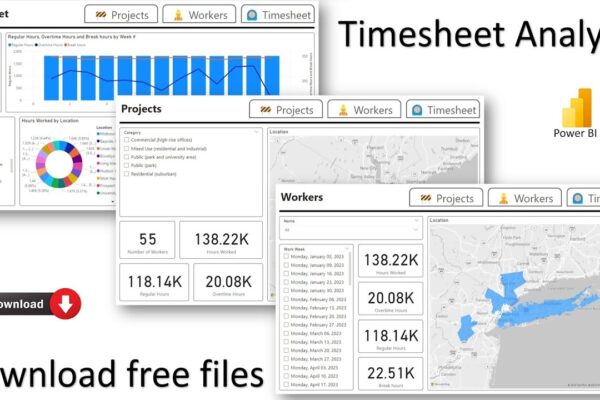
Timesheet Analysis | Construction Co. Example | Worker Hours Report | Project Management

The video provides a walkthrough of how to analyze time sheet data of construction workers in NYC using Microsoft Excel and Power BI. It covers importing data from Excel, creating relationships between tables, building visualizations, and using slicers to filter data. The tutorial also demonstrates how to calculate weekly work hours and create charts to…

Read More

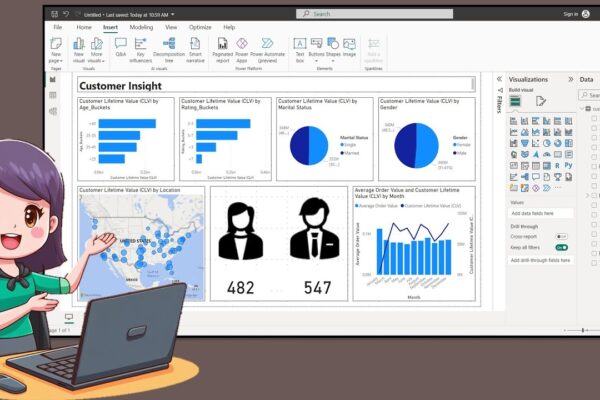
How to Create a Nice Customer Insight Dashboar in Power BI Desktop

In this tutorial, the presenter welcomes the audience back and introduces the creation of a customer insight dashboard using data available on Kaggle. The process involves creating age and rating buckets using Data Analysis Expression, exporting icons from PowerPoint, and incorporating them into the dashboard. The tutorial covers turning on map visuals, adjusting canvas size,…

Read More