
IMBD Top 1000 Movies Dashboard: How to Use Text Slicer Effectively
Douwnload Dataset and PBI file: https://drive.google.com/…/1WdUPqB2yJ7_062jAMVO…/view… AI Description: This image serves as an engaging YouTube…


Douwnload Dataset and PBI file: https://drive.google.com/…/1WdUPqB2yJ7_062jAMVO…/view… AI Description: This image serves as an engaging YouTube…

Welcome back! In this interesting Power BI tutorial, we show you how to elevate your…

Welcome to this in-depth Power BI tutorial where we dive into comparative sales analysis! Learn…

Dive into the powerful concept of self-referencing relationships in SQL Server, a technique essential for…
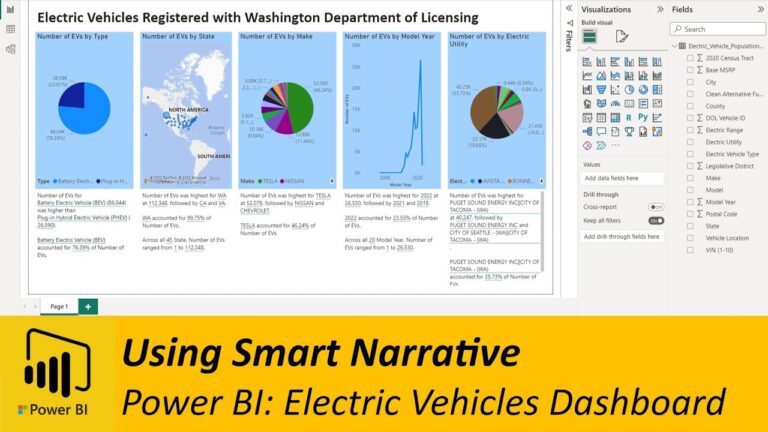

Douwnload Dataset and PBI file: https://drive.google.com/…/1WdUPqB2yJ7_062jAMVO…/view… AI Description: This image serves as an engaging YouTube thumbnail for a tutorial titled…

Welcome back! In this interesting Power BI tutorial, we show you how to elevate your dashboards by incorporating cool, responsive…

Welcome to this in-depth Power BI tutorial where we dive into comparative sales analysis! Learn step-by-step how to analyze and…

Dive into the powerful concept of self-referencing relationships in SQL Server, a technique essential for modeling hierarchical or sequential data…

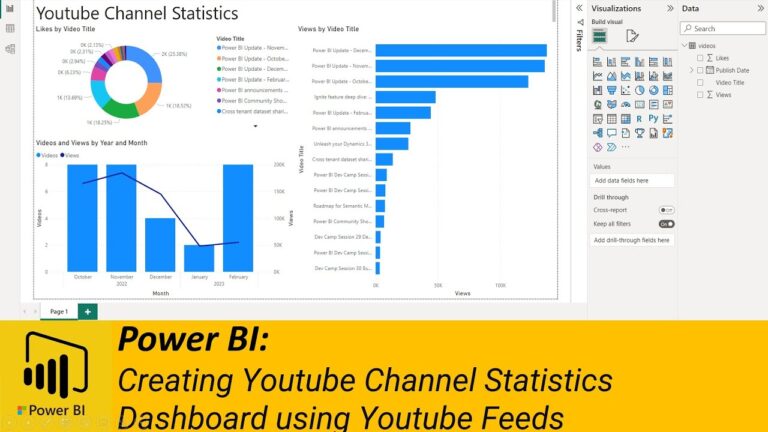
Learn how to transform a simple dataset into a visually engaging Power BI dashboard in this step-by-step tutorial. We kick…

This video introduces Custom Views and Sheet Views in Microsoft Excel as features to boost efficiency by saving time and…

Unlock the full potential of Power Query M language by mastering Custom Functions! In this comprehensive tutorial, you’ll learn exactly…

Dive into this comprehensive Power BI tutorial to master the art of line statistics and data visualization on a scatter…

This comprehensive SQL tutorial for beginners will walk you through the essential UPDATE and DELETE commands in SQL. Learn how…

This tutorial guides you through harnessing the power of Python visuals in Power BI to perform data analysis and predictive…