

Skip to content
Thursday, November 12, 2026
Starting with SQL Server and Adding the Northwind Sample Database
Learn Automation with Google Colab: Collect Data, Prepare Reports, Send Emails with One Click
Power Query vs DAX for Beginners: When to Use Which in Power BI?
How to Peform YoY Comparison in Power BI – For Begginers

Virtual School

This Week
  • Home
  • Profile
  • Topics
  • Video Tutorials
  • Resources
Starting with SQL Server and Adding the Northwind Sample Database
Learn Automation with Google Colab: Collect Data, Prepare Reports, Send Emails with One Click
Power Query vs DAX for Beginners: When to Use Which in Power BI?
How to Peform YoY Comparison in Power BI – For Begginers

Virtual School

This Week
  • Home
  • Profile
  • Topics
  • Video Tutorials
  • Resources

Starting with SQL Server and Adding the Northwind Sample Database

2 months ago2 months ago

Learn Automation with Google Colab: Collect Data, Prepare Reports, Send Emails with One Click

2 months ago2 months ago

Power Query vs DAX for Beginners: When to Use Which in Power BI?

2 months ago2 months ago

How to Peform YoY Comparison in Power BI – For Begginers

3 months ago3 months ago

Complete Power BI Tutorial with Custom Graphics, Animated Background, Dynamic Values and Much More – Global E-Commerce Supply Chain

3 months ago3 months ago

North American Company

4 months ago4 months ago

How to Fix Mapping Errors in Power BI (Accurate Location Data Tutorial)

4 months ago4 months ago

Power BI: Build a Dynamic Risk Matrix Simulation in Power BI Using DAX & Parameters

4 months ago4 months ago

Excel: How to Correct Wrong Date Formats in Seonds without using Complex Forumulas and Methods.

4 months ago4 months ago

Power BI Desktop: Creating Dashboard with 60,000 Plus Photos and Generating Dataset from file names

4 months ago4 months ago
  • Home
  • projectmanagement

projectmanagement

  • Power BI

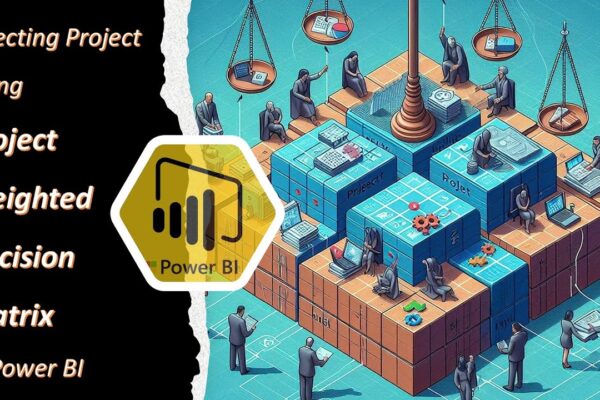
Project Weighted Decision Matrix Dashboard

Shahid Latif2 years ago2 years ago01 mins

This video tutorial demonstrates how to use Power BI to perform a weighted decision matrix analysis on a set of projects. We start by loading an Excel file containing project details, criteria, scores, and weights. Then, we create a new table called “Weighted Score” and populate it with the product of score and weight for…
Read More
  • Power BI

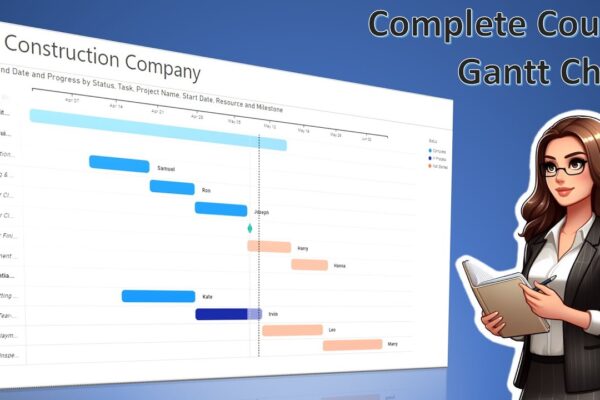
Gantt Chart in Power BI: Complete Guide

Shahid Latif3 years ago2 years ago01 mins

This video tutorial explains how to create a Gantt chart in Power BI. It walks you through the data required, including tasks, start dates, and end dates. You can also include additional information such as projects, progress, resources, and milestones. The video also shows how to import a custom Gantt chart visual and configure it…

Read More
  • Power BI

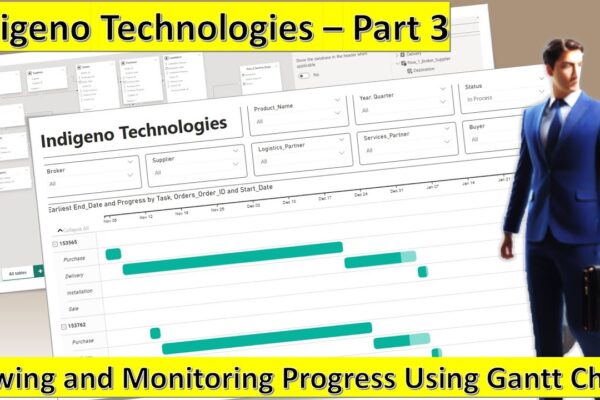
Monitoring Progress Using Gantt Chart – Indigeno Technologies Part 3

Shahid Latif3 years ago2 years ago01 mins

This video is part of a multi-part tutorial on using Power BI with a dataset called Indigino Technologies. In this particular part, you will learn how to create a Gantt chart to track the progress of orders. The video walks you through the steps of adding the necessary columns to your tables, formatting the data…

Read More
Log in
  • Apps (1)
  • Resources (1)
    • Datasets (1)
  • Topics (12)
    • Data Analysis Expression (DAX) (3)
      • Complete List of DAX Functions (2)
    • Google Looker Studio (3)
      • Complete Guide to the Looker Studio (1)
    • MS Excel (1)
      • Mastering MS Excel (1)
    • Power BI (1)
    • Python (4)
      • Python Complete Course (4)
  • Uncategorized (2)
  • Video Tutorials (320)
    • C# (1)
    • DAX (10)
    • Google Charts (2)
    • HTML (8)
    • JavaScript (8)
    • Looker Studio (12)
    • Maths (1)
    • MS Access (1)
    • MS Excel (62)
    • MS Power Point (3)
    • Other (1)
    • Power Apps (1)
    • Power Automate (4)
    • Power BI (153)
    • Power Query (M Language) (4)
    • Python (56)
    • Quiz (1)
    • R (3)
    • SQL (33)
    • Tableau (1)
    • Unity3d (1)
    • Windows PowerShell (1)

Recent Posts

  • Starting with SQL Server and Adding the Northwind Sample Database
  • Learn Automation with Google Colab: Collect Data, Prepare Reports, Send Emails with One Click
  • Power Query vs DAX for Beginners: When to Use Which in Power BI?
  • How to Peform YoY Comparison in Power BI – For Begginers
  • Complete Power BI Tutorial with Custom Graphics, Animated Background, Dynamic Values and Much More – Global E-Commerce Supply Chain

Recent Comments

  1. Admin on Complete Guide to the Looker Studio: Sharing Looker Studio Reports
  2. Nik A Hafiz on Complete Guide to the Looker Studio: Sharing Looker Studio Reports
  3. Admin on Power BI: Monitor Risk using Capital Adequacy and Risk Weighted Assets Dashboard
  4. Augustine Ahiatsi on Power BI: Monitor Risk using Capital Adequacy and Risk Weighted Assets Dashboard
Log in
  • Home
  • Profile
  • Topics
  • Video Tutorials
  • Resources

Copyright 2025 virtual-school.org