

Skip to content
Thursday, November 12, 2026
Starting with SQL Server and Adding the Northwind Sample Database
Learn Automation with Google Colab: Collect Data, Prepare Reports, Send Emails with One Click
Power Query vs DAX for Beginners: When to Use Which in Power BI?
How to Peform YoY Comparison in Power BI – For Begginers

Virtual School

This Week
  • Home
  • Profile
  • Topics
  • Video Tutorials
  • Resources
Starting with SQL Server and Adding the Northwind Sample Database
Learn Automation with Google Colab: Collect Data, Prepare Reports, Send Emails with One Click
Power Query vs DAX for Beginners: When to Use Which in Power BI?
How to Peform YoY Comparison in Power BI – For Begginers

Virtual School

This Week
  • Home
  • Profile
  • Topics
  • Video Tutorials
  • Resources

Starting with SQL Server and Adding the Northwind Sample Database

2 months ago2 months ago

Learn Automation with Google Colab: Collect Data, Prepare Reports, Send Emails with One Click

2 months ago2 months ago

Power Query vs DAX for Beginners: When to Use Which in Power BI?

2 months ago2 months ago

How to Peform YoY Comparison in Power BI – For Begginers

3 months ago3 months ago

Complete Power BI Tutorial with Custom Graphics, Animated Background, Dynamic Values and Much More – Global E-Commerce Supply Chain

3 months ago3 months ago

North American Company

4 months ago4 months ago

How to Fix Mapping Errors in Power BI (Accurate Location Data Tutorial)

4 months ago4 months ago

Power BI: Build a Dynamic Risk Matrix Simulation in Power BI Using DAX & Parameters

4 months ago4 months ago

Excel: How to Correct Wrong Date Formats in Seonds without using Complex Forumulas and Methods.

4 months ago4 months ago

Power BI Desktop: Creating Dashboard with 60,000 Plus Photos and Generating Dataset from file names

4 months ago4 months ago
  • Home
  • line chart

line chart

  • Power BI

How to Peform YoY Comparison in Power BI – For Begginers

Shahid Latif3 months ago3 months ago01 mins

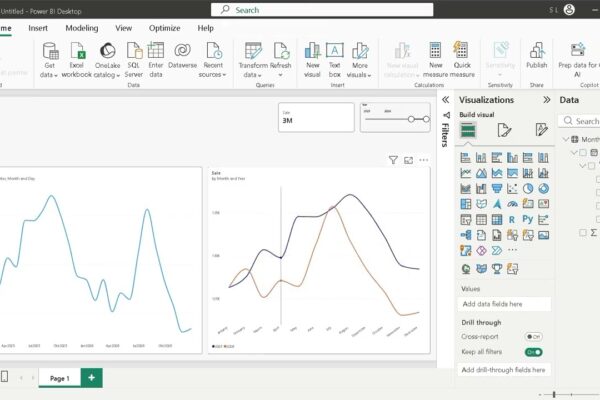
Learn how to transform raw Excel data into an interactive, year-over-year (YoY) sales comparison dashboard using Power BI Desktop. Starting with data import and formatting, this guide covers setting up custom currency and date hierarchies, configuring a dynamic line chart with slicers, and adding metric cards with custom borders and padding. By breaking down dates…
Read More
  • Power BI

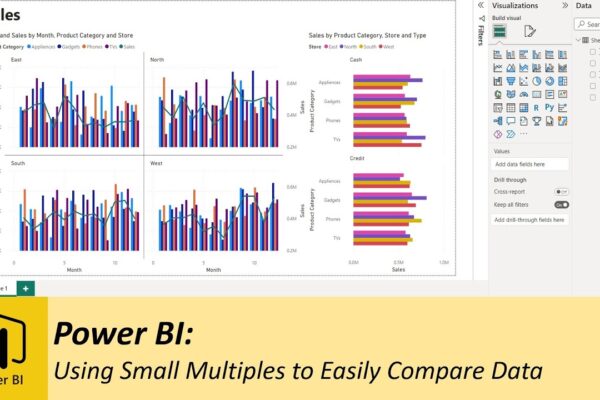
Using Small Multiples to Easily Compare Data in Power BI

Shahid Latif4 years ago2 years ago01 mins

In this video, we will explore the concept of small multiples, which is a series of similar graphs or charts using the same scale and axes, allowing them to be easily compared. We will create a dashboard using visuals with small multiple features and import data into Power BI Desktop using the “Get Data” feature….

Read More
Log in
  • Apps (1)
  • Resources (1)
    • Datasets (1)
  • Topics (12)
    • Data Analysis Expression (DAX) (3)
      • Complete List of DAX Functions (2)
    • Google Looker Studio (3)
      • Complete Guide to the Looker Studio (1)
    • MS Excel (1)
      • Mastering MS Excel (1)
    • Power BI (1)
    • Python (4)
      • Python Complete Course (4)
  • Uncategorized (2)
  • Video Tutorials (320)
    • C# (1)
    • DAX (10)
    • Google Charts (2)
    • HTML (8)
    • JavaScript (8)
    • Looker Studio (12)
    • Maths (1)
    • MS Access (1)
    • MS Excel (62)
    • MS Power Point (3)
    • Other (1)
    • Power Apps (1)
    • Power Automate (4)
    • Power BI (153)
    • Power Query (M Language) (4)
    • Python (56)
    • Quiz (1)
    • R (3)
    • SQL (33)
    • Tableau (1)
    • Unity3d (1)
    • Windows PowerShell (1)

Recent Posts

  • Starting with SQL Server and Adding the Northwind Sample Database
  • Learn Automation with Google Colab: Collect Data, Prepare Reports, Send Emails with One Click
  • Power Query vs DAX for Beginners: When to Use Which in Power BI?
  • How to Peform YoY Comparison in Power BI – For Begginers
  • Complete Power BI Tutorial with Custom Graphics, Animated Background, Dynamic Values and Much More – Global E-Commerce Supply Chain

Recent Comments

  1. Admin on Complete Guide to the Looker Studio: Sharing Looker Studio Reports
  2. Nik A Hafiz on Complete Guide to the Looker Studio: Sharing Looker Studio Reports
  3. Admin on Power BI: Monitor Risk using Capital Adequacy and Risk Weighted Assets Dashboard
  4. Augustine Ahiatsi on Power BI: Monitor Risk using Capital Adequacy and Risk Weighted Assets Dashboard
Log in
  • Home
  • Profile
  • Topics
  • Video Tutorials
  • Resources

Copyright 2025 virtual-school.org