The Foundation of Data: Sourcing, Structuring, and Importing with Python for Beginners

Data is fundamentally a collection of random events and observations from the world around us that, while unpredictable individually, can be analyzed for deeper patterns. To make sense of this chaos, we organize these events into a structured “grid” known in Python as a DataFrame. In this architecture, rows represent individual participants or events, while…

Read More

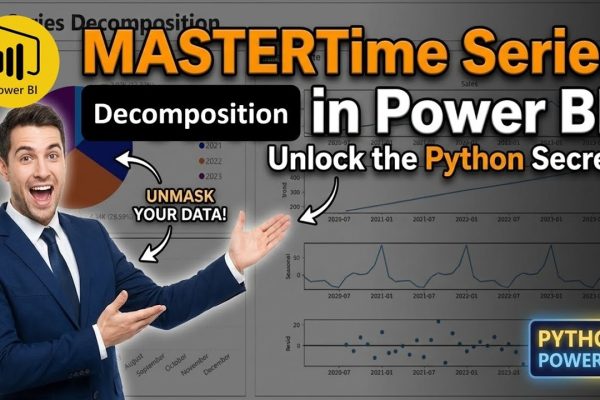
Power BI: How to Isolate Trend & Seasonality Using Python Time Series Decomposition Technique

Unlock the full potential of your data by mastering Time-Series Decomposition directly within Power BI. While standard line charts often conflate different signals, this tutorial shows you how to use the statsmodels library to “unmask” your metrics. You will learn to isolate the Trend, identify recurring Seasonality, and quantify the Residual noise that native visuals…

Read More