
Advanced Customer Segmentation: Venn Diagrams in Power BI with Python
Unlock the full potential of your data storytelling by mastering the visual Power BI forgot….


Unlock the full potential of your data storytelling by mastering the visual Power BI forgot….

Unlock the full potential of your data by mastering Time-Series Decomposition directly within Power BI….

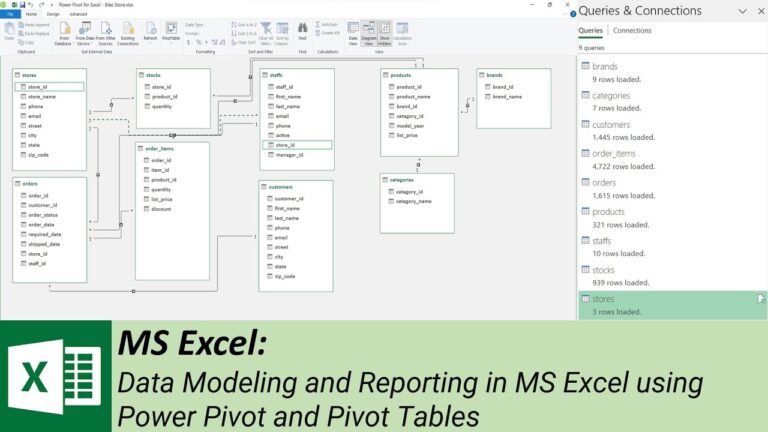
This video demonstrates how to seamlessly integrate Microsoft Excel with SQL Server to streamline data…

Generating a large, customized dataset for practice in Power BI, SQL, or Python doesn’t have…

Unlock the full potential of your data storytelling by mastering the visual Power BI forgot. While Power BI is an…

Unlock the full potential of your data by mastering Time-Series Decomposition directly within Power BI. While standard line charts often…

This video demonstrates how to seamlessly integrate Microsoft Excel with SQL Server to streamline data reporting and visualization. The process…

Generating a large, customized dataset for practice in Power BI, SQL, or Python doesn’t have to involve writing complex scripts…

In this tutorial, we dive into the powerful world of statistical data visualization by building a comprehensive sales dashboard in…

Douwnload Dataset and PBI file: https://drive.google.com/…/1WdUPqB2yJ7_062jAMVO…/view… AI Description: This image serves as an engaging YouTube thumbnail for a tutorial titled…

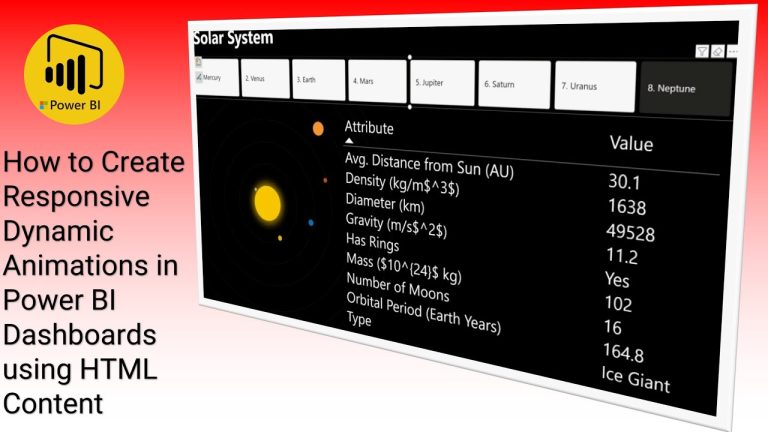
Welcome back! In this interesting Power BI tutorial, we show you how to elevate your dashboards by incorporating cool, responsive…

Welcome to this in-depth Power BI tutorial where we dive into comparative sales analysis! Learn step-by-step how to analyze and…

Dive into the powerful concept of self-referencing relationships in SQL Server, a technique essential for modeling hierarchical or sequential data…

Learn how to transform a simple dataset into a visually engaging Power BI dashboard in this step-by-step tutorial. We kick…